Why Is My Linux Server Slow? 10 Possible Causes to Check
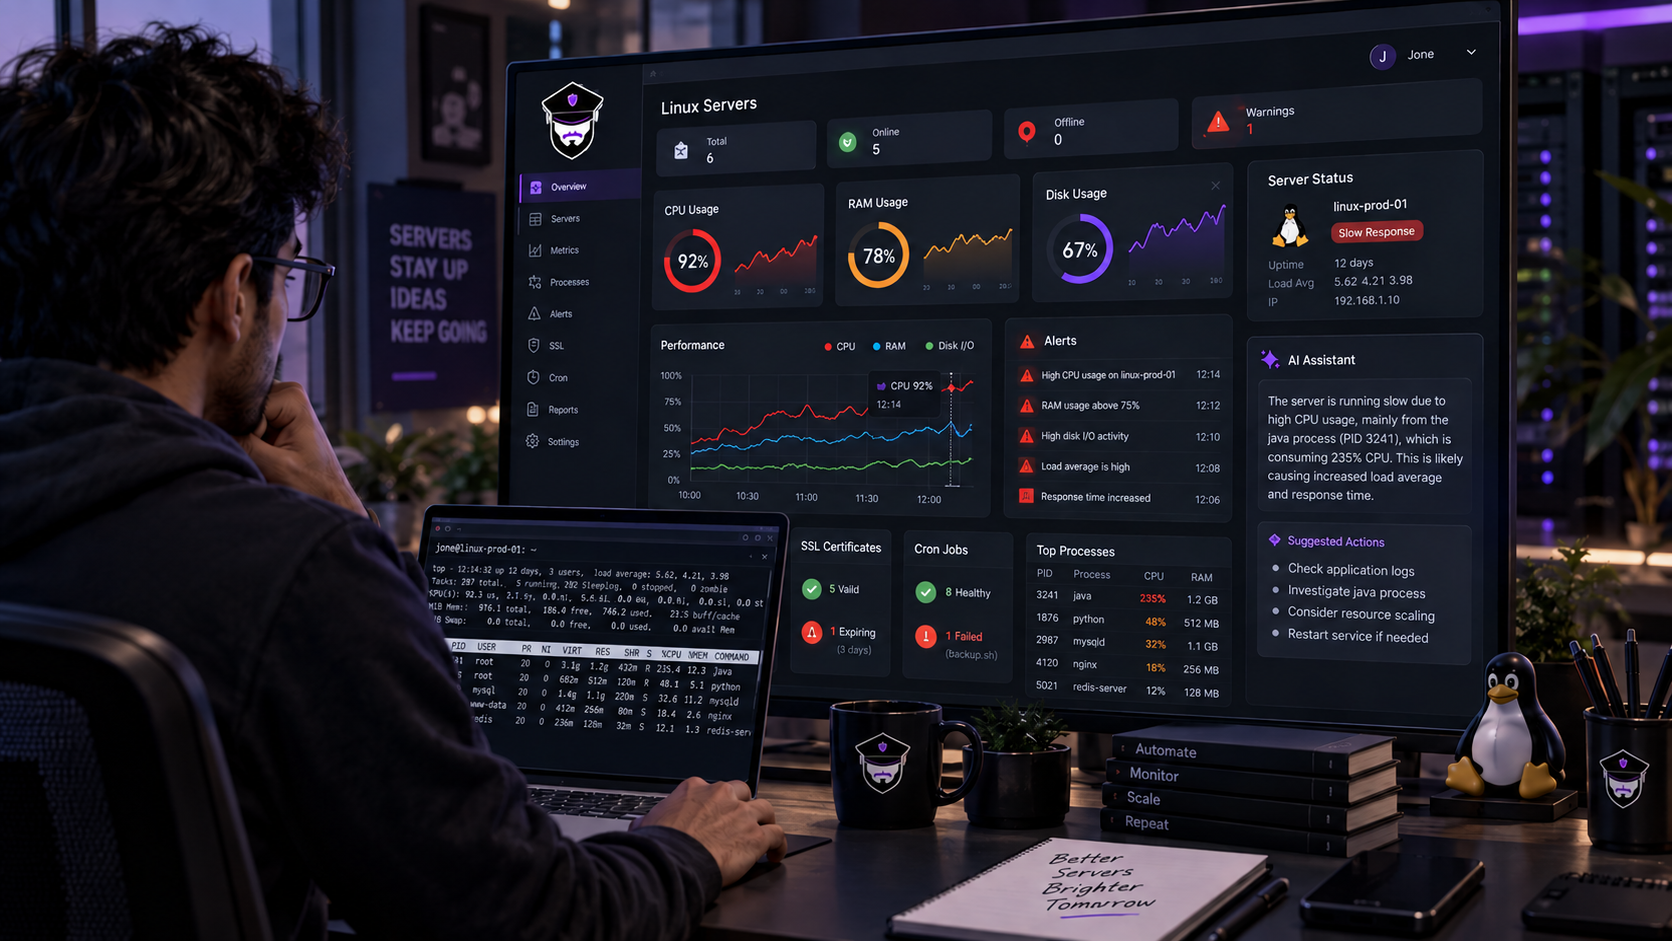
Your website is still online. Your server is still running. There is no obvious error. But everything feels slow. Pages take longer to load. Admin panels become frustrating to use. Background jobs take longer than usual. Sometimes, the server even feels fine for a few minutes and then becomes slow again. This can be confusing. If the server hasn't gone down, what is causing the slowdown? The answer is usually hidden somewhere inside the server.
A Slow Server Is Not the Same as a Server Being Down
When a server goes offline, the problem is usually obvious. Nothing works. A slow server is different. The server may still respond to requests, but something is preventing it from working efficiently. For example:
- CPU may be overloaded
- RAM may be running low
- A process may be consuming too many resources
- Database queries may be taking too long
- Disk activity may be unusually high
- Network traffic may have increased
- Background jobs may be consuming resources
The challenge is finding which one is responsible.
1. CPU Usage Is Too High
CPU is one of the first things people check when a server becomes slow. If CPU usage remains very high, applications may have to compete for processing time. This can happen because of:
- Increased website traffic
- Heavy application requests
- Background processing
- Large scripts
- Runaway processes
- Scheduled jobs
But there is an important detail. A short CPU spike is not necessarily a problem. If CPU reaches 90% for a few seconds and returns to normal, your server may be perfectly healthy. The bigger concern is high CPU that continues for a long period.
2. Your Server Is Running Low on RAM
RAM problems can be harder to notice. You may have enough CPU available, but if memory is nearly exhausted, applications can become slow or unstable. For example, imagine a server running:
Web server, PHP, Database, Background workers, Monitoring agent
As traffic and workload increase, these services may consume more memory. Eventually, the server has very little memory left. The result can be slower applications and unpredictable performance.
3. One Process Is Consuming Too Many Resources
Sometimes the entire server isn't the problem. One process is. A single process can suddenly consume a large amount of CPU or memory. For example:
Normal situation php-fpm → normal
Problem situation php-fpm → unusually high CPU
The same thing can happen with database processes, background workers, scripts, or other applications. This is why looking at overall CPU usage isn't always enough. You also need to know which process is responsible.
"A slow server doesn't always mean the server needs more resources. Sometimes one process simply needs attention."
4. Your Database Is Taking Too Long
Your website may appear slow even when the Linux server itself looks healthy. One possible reason is the database. Imagine a visitor opens a page. The application asks the database for information. The database takes several seconds to return the result. The visitor waits. From the user's perspective, the website is slow. The server may still show moderate CPU and RAM usage. This is why performance troubleshooting should look beyond basic resource usage.
5. Too Many Background Jobs Are Running
Servers often perform work in the background. This could include:
- Backups
- Data imports
- Report generation
- Image processing
- Scheduled cleanup
- Queue processing
- Cron jobs
Individually, these tasks may be fine. But if several heavy jobs run at the same time, they can compete with your website for resources. For example:2:00 AM Backup starts.
2:05 AM Data processing starts.
2:10 AM Another scheduled task starts.
Suddenly, your server has much more work to do than normal. Monitoring historical activity can help you identify patterns like this.
6. Disk Activity Is Becoming a Bottleneck
Disk problems are not always about running out of storage. Your server can have plenty of free space and still experience heavy disk activity. Applications that frequently read or write large amounts of data can put additional pressure on storage. Examples include:
- Large log files
- Database activity
- Backup operations
- File processing
- Large uploads
- Temporary file creation
So when investigating performance, don't only ask: "How much disk space is left?" Also ask: "How is the disk being used?"
7. Network Traffic Has Increased
Sometimes your server isn't struggling with CPU or RAM. The problem may be network activity. A sudden increase in traffic can happen because of:
- More visitors
- Large downloads
- API activity
- File transfers
- Automated requests
- Unexpected traffic
If network activity changes significantly, it can affect the way applications respond to users. Looking at network trends can help you determine whether the slowdown happened at the same time as a traffic increase.
8. A Service Is Working Poorly
Modern websites often depend on several services working together. For example: Nginx → PHP → Application → Database
If one service becomes unhealthy, the entire application can feel slow. The server itself may still be online. The problem could be a service that is:
- Overloaded
- Restarting
- Stuck
- Running incorrectly
- Waiting for another service
This is why service status can provide useful clues during performance investigations.
9. The Problem Happens Only During Certain Times
Sometimes the server isn't permanently slow. It becomes slow at specific times. Maybe: 9:00 AM – Normal 1:00 PM – Normal 2:00 PM – Slow 3:00 PM – Normal If you only check the server after the problem disappears, everything may look fine. Historical monitoring changes the investigation.
Instead of asking: "What is happening right now?" you can ask: "What happened when the server became slow?" That difference can make troubleshooting much easier.
10. Your Server May Simply Be Under-Provisioned
Sometimes there isn't a software bug. Your server may simply no longer have enough resources for the workload. For example, a website may have started with: 2 CPU cores + 4 GB RAM At that time, everything worked well. Months later:
- Traffic increased
- More users arrived
- More background jobs were added
- The database became larger
- More applications were installed
The same server now has much more work to handle. In this situation, upgrading may make sense. But it is better to confirm this using actual usage data rather than upgrading based on a guess.
Don't Restart the Server Too Quickly
Restarting a server can sometimes make the problem disappear. But that doesn't mean you fixed it. A restart may temporarily:
- Stop a runaway process
- Clear memory pressure
- Restart unhealthy services
- Remove temporary workload
But if the underlying cause remains, the problem may return later. Instead of immediately restarting, try to understand: What was consuming the resources? When did it start? What changed? Does it happen repeatedly?
Look for Patterns, Not Just Numbers
A single number doesn't always tell the complete story. For example: CPU: 85% That might look concerning. But what if CPU was 85% for only 20 seconds? It may not matter. Now consider: CPU: 85% → 88% → 91% → 94% over several hours. That tells a different story. Historical trends can reveal whether a problem is:
- Temporary
- Repeating
- Gradually increasing
- Connected to a specific event
- Getting worse over time
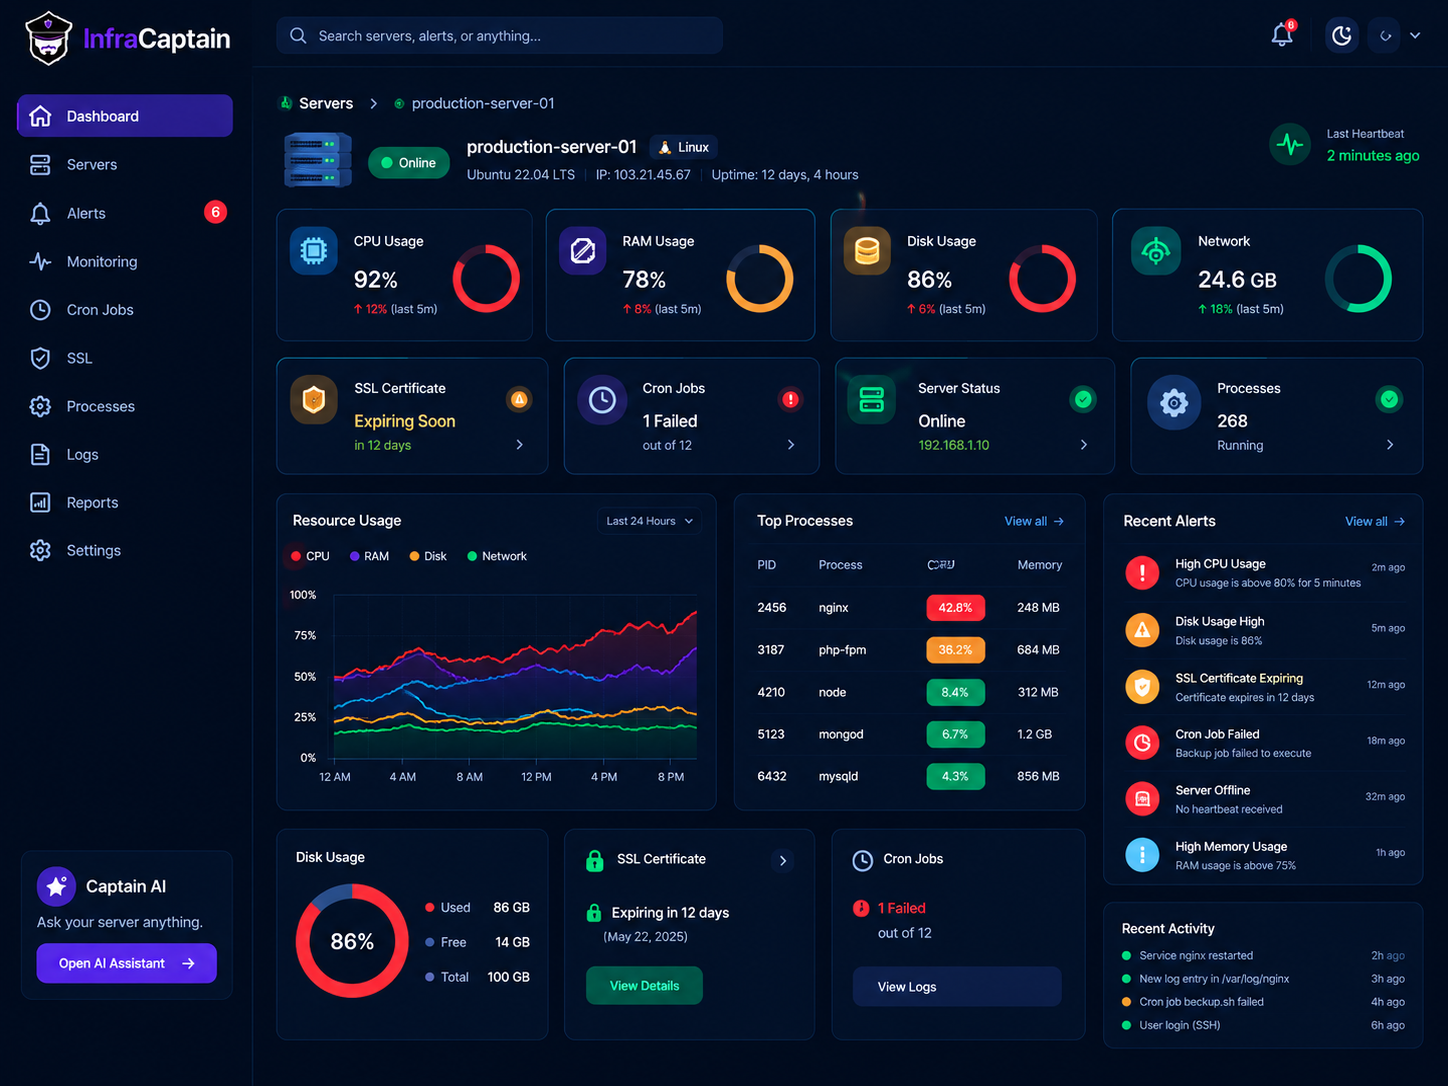
How Monitoring Helps Find Slow Server Problems
When a server becomes slow, manually checking everything can take time. You may need to inspect:
- CPU
- RAM
- Disk
- Network
- Processes
- Services
- Logs
- Cron jobs
- Database activity
A monitoring dashboard brings many of these signals together. Instead of looking at the server only when something goes wrong, you can compare current performance with historical data.
What InfraCaptain Can Show You
InfraCaptain continuously collects server health and infrastructure signals, including CPU, RAM, disk, network, processes, services, cron activity, SSL information, and security events.
The dashboard provides current information along with historical performance trends. This makes it easier to answer questions such as:
Did CPU suddenly increase? Has memory usage been growing? Which processes are consuming resources? Did something change around the time the server became slow?
Captain AI Can Help Investigate Performance Problems
Sometimes you can see the numbers but still don't know what they mean. For example:
- CPU: 88%
- RAM: 82%
- Process X: High CPU
The next question is: Why? Captain AI can use available server context, including resource history, process states, cron records, and log patterns, to help investigate questions such as: "Why is my CPU at 88%?" or: "Is there a memory leak?" This can help turn a collection of server metrics into a more understandable explanation.
Before Upgrading Your Server, Check the Data
When a server becomes slow, the easiest solution may seem to be buying a bigger server. Sometimes that's the right answer. But sometimes it isn't. If one process is consuming excessive CPU, adding more CPU may only hide the real problem. If a database query is slow, more RAM may not solve it. If a scheduled job is causing the slowdown every night, upgrading the server may not be necessary. First find the bottleneck. Then decide what action makes sense.
A Simple Checklist for a Slow Linux Server
When your Linux server feels slow, check:
- CPU: Is usage consistently high?
- RAM: Is available memory getting low?
- Processes: Is one process consuming unusually high resources?
- Disk: Is there heavy disk activity?
- Network: Has traffic suddenly increased?
- Services: Is an important service unhealthy?
- Database: Are database operations taking longer?
- Cron: Did a scheduled job start around the same time?
- History: Has this happened before?
- Capacity: Has your workload outgrown the server?
Conclusion
A slow Linux server doesn't always mean that your server is about to crash.
It may be caused by high CPU, low memory, a resource-heavy process, database activity, background jobs, network traffic, unhealthy services, or simply a workload that has grown over time.
The difficult part is finding the real cause. That's why looking at historical trends and multiple server signals together is more useful than checking one metric in isolation.
The next time someone says: "The server is slow." Don't immediately restart it. Don't immediately upgrade it. First ask: "What changed?" Once you know what changed, you have a much better chance of fixing the actual problem.
Need Help with Your Infrastructure?
Get expert assistance with monitoring, DevOps, and infrastructure management.
Contact Us